App Analytics
Part of Mobile growth programme reviews
Connecting acquisition, activation and retention metrics
Follow one eligible app cohort from entry to first value and later use, with clear denominators and limits on store-to-app comparisons.
Connect acquisition, activation and retention by following one eligible entry group through first use and later useful action. Keep the starting event, identity rule and outcome windows beside the counts. Store downloads and app activity from separate reports cannot simply be divided into a journey rate.
Build the cohort bridge
Start with a dated group of recorded first opens, or another entry event the app can identify consistently. Attach an acquisition label under one stated source rule. Then define who could perform the first task, what confirmed its result, and when a later useful action could count.
| Stage | Count to retain | Question answered |
|---|---|---|
| Entry | Distinct starting-cohort members | Who reached the measured app route? |
| Eligible entry | Starting members able to perform the task | Who had a genuine opportunity? |
| Activation | Eligible members completing the first useful result | Who reached first value? |
| Later use | Members of that same eligible group completing a defined later action | Who used the app again in the stated window? |
Check any task completion event against the product’s successful state. A view or attempt is useful context but does not confirm completion.
Connecting Acquisition, Activation and Retention Metrics
- EntryDistinct starting-cohort members
- Eligible entryStarting members able to perform the task
- ActivationEligible members completing the first useful result
- Later useMembers of that same eligible group completing a defined later action
Keep each rate’s population clear
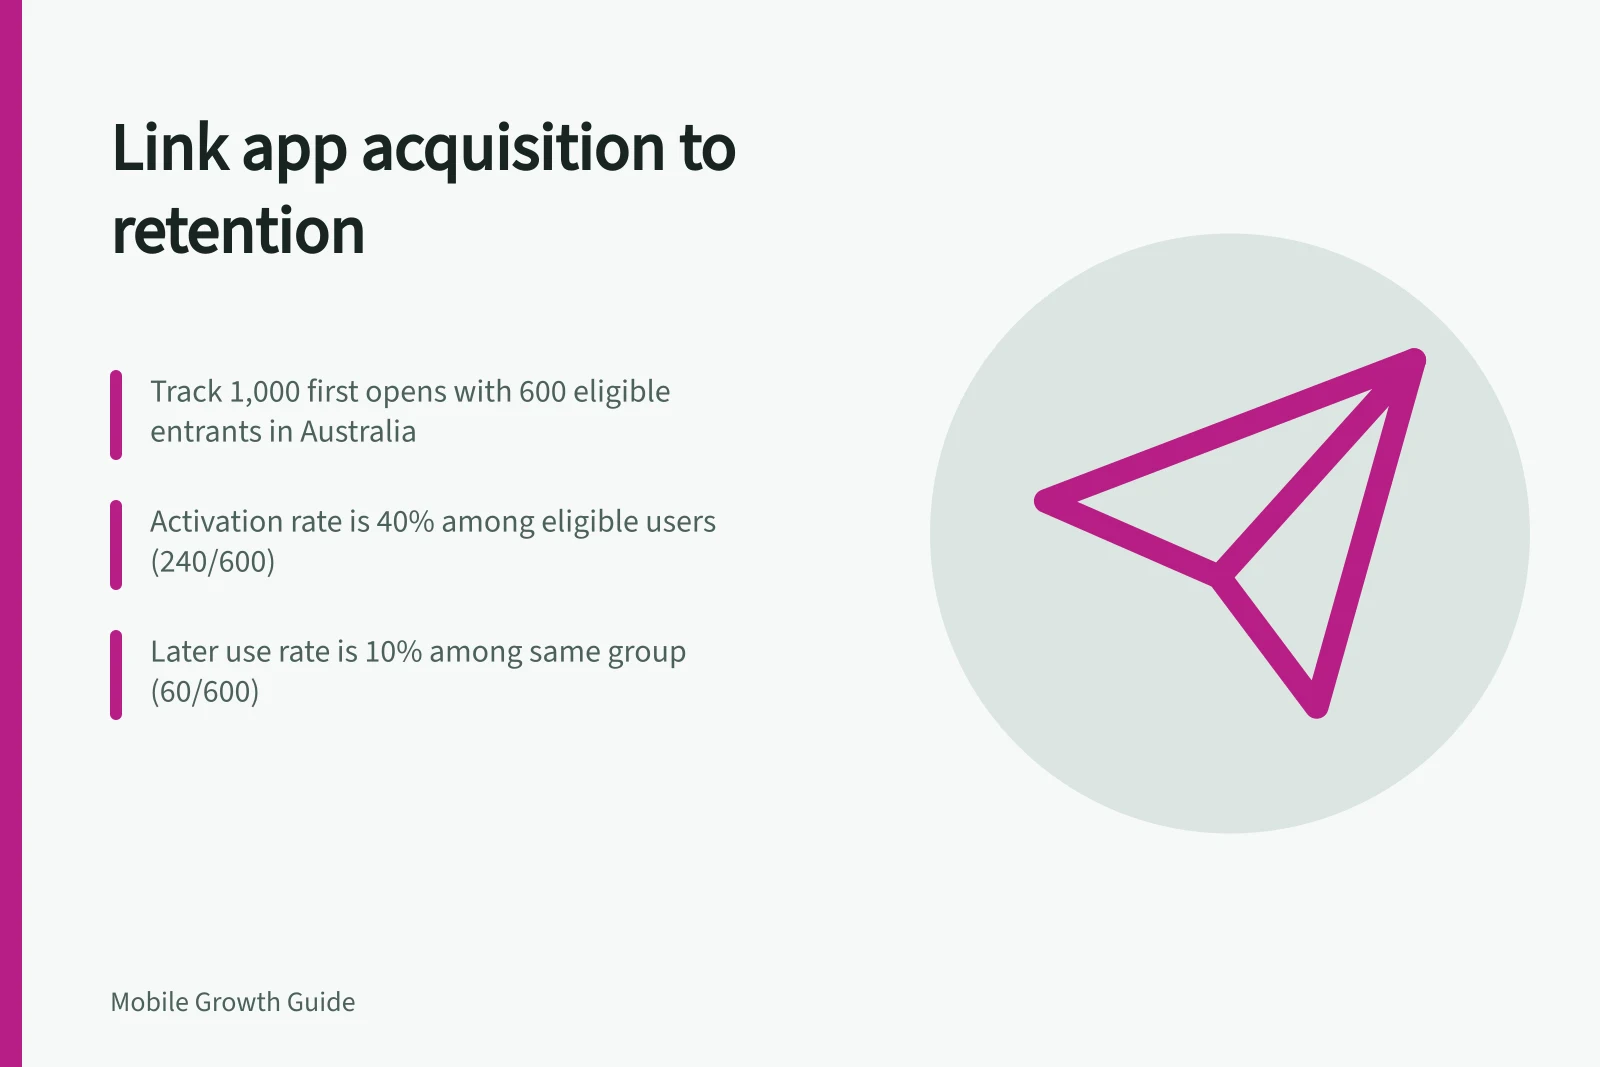
Suppose a hypothetical cohort contains 1,000 recorded first opens. Of those, 600 are eligible, 240 complete the task in the activation window, and 60 of the eligible group perform the specified later action in a fully observed return window.
Activation among eligible entrants is 240 ÷ 600, or 40%. Later use among eligible entrants is 60 ÷ 600, or 10%. These figures illustrate arithmetic, not a benchmark.
A return rate among activated users needs a different numerator: activated members who later acted. The example does not say how many of the 60 were activated, so it cannot supply that rate. Record how reinstalls and multiple devices are joined before calculating either rate.
Set store and campaign data beside the bridge
A store report can explain an earlier step without supplying the app cohort’s denominator. Store and app reports may use different measures, identity rules and timing, so they do not automatically connect every store event to an app cohort. Apple’s app-usage data covers people who agreed to share it.
Show store interactions, acquisitions and campaign spend as separately labelled context when a defensible cohort match is unavailable. Keep ineligible entrants visible as a separate count. For a service offered only in selected Australian areas, removing people outside those areas from the task denominator changes the question being answered.
Use the connected view to locate a question: did the eligible share change, did fewer eligible entrants complete the task, or did fewer cohort members make useful later use? Preserve the cohort specification so the next comparison uses the same rules.