
App Analytics
Part of Mobile growth programme reviews
Diagnosing growth with rising installs but flat active users
Check metric definitions and follow comparable cohorts to locate why installs rise while app active users remain flat.
Rising installs with flat active users is a reason to investigate, not a diagnosis. First check what each chart counts and whether its periods and populations match.
Examine new-user entry, first-task success and use by established users separately. A flat total can conceal movement in either direction: more new users can be offset by established users who stop returning.
Verify the apparent gap
Name the store metric behind the install line. In App Store Connect, First Time Downloads counts first-time downloads, Redownloads counts redownloads, and Total Downloads is the sum of the two. In Google Play Console, user acquisitions count users who didn't have your app on any of their devices, while device acquisitions count devices the app was installed on.
A rise in redownloads or device acquisitions can lift an install chart without adding new people. Google Play also labels acquisitions it cannot attribute to a traffic source as 'Not attributed', including reactivations and installs from Play backup and restore, so check the traffic-source breakdown before reading the rise as new demand.
Name the active-use measure too. In Google Analytics 4, "Active users" is the number of people who engaged with your site or app in the specified date range, and Google notes that not all new users are active, so new users may exceed active users. Check how any other analytics platform defines active use before comparing.
Apple's Active Devices counts devices with at least one session of two seconds or more in the selected period, and its app-usage data covers people who agreed to share it. Neither is a universal count of people who completed a useful task.
Check report filters, geography, SDK coverage, consent coverage, app version and dates. In a rolling active-user window, new qualifying users can be offset by others who cease to qualify.
Check deletion and crash metrics by app version and period as additional diagnostic signals. Apple's usage metrics include installations, sessions, active devices, crashes and deletions: deletions may help explain users leaving, while crash patterns may point to stability issues.
App Store Connect vs Google Play Console: Install Metrics Compared
- Apple App Store Connect - First Time Downloads
- Counts first-time downloads only
- Apple App Store Connect - Redownloads
- Counts re-downloads by users who previously uninstalled the app
- Apple App Store Connect - Total Downloads
- Sum of First Time Downloads and Redownloads
- Google Play Console - User Acquisitions
- Users who did not have the app on any device before installation
- Google Play Console - Device Acquisitions
- Devices the app was installed on, including re-installs
- Google Play Console - Not Attributed
- Acquisitions without a traffic source; includes reactivations and backup restores
Key Active User Definitions in Analytics Platforms
- Google Analytics 4 - Active UsersPeople who engaged with your app in the selected date range
- Apple App Store Connect - Active DevicesDevices with at least one session of two seconds or more in the period
- Note on Active UsersNot all new users are active; new user counts may exceed active user counts
Locate the first missing outcome
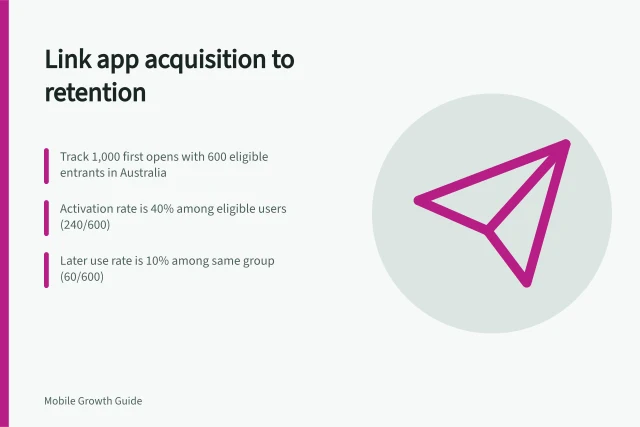
Follow a dated, eligible new-user cohort where the records support it:
- Store action to first open:Check the route to launch. If store and app records cannot be joined, show the counts separately rather than making a conversion rate. Google Analytics logs
first_openthe first time a user launches an app after installing or reinstalling it, not when the app is downloaded, so it will not match store download counts. - First open to eligibility:Could the person use the advertised task on that device and in that service area?
- Eligibility to confirmed result:Did the task succeed? Compare attempts and errors with a verified completion state.
- First result to later use:Was there a plausible later need, and could the person retrieve or continue the result?
Use retention to read step four. Apple's app retention shows the percentage of active devices that installed the app on the selected day and opened it a certain number of days later; users who install but never open the app are not counted. Day 1 retention, for example, shows the share of active devices that opened the app one day after installation.
For an app serving selected Australian locations, more downloads outside those locations could increase entry without increasing eligible completions. Compare downloads by territory with the locations the app actually serves.
Separate new and established use
Use cohort records to compare new entrants with established users under consistent identity and time rules. Do not obtain one group by subtracting unrelated dashboard totals. Check the reporting rules for each user measure before comparing or combining figures.
If new cohorts complete the task and later return at a similar pace, inspect the established-user journey and whether another need arose. If first-task completion weakens in one app version, inspect its product states and event firing. If the change follows a campaign, compare its audience and promise with earlier entry groups before attributing the pattern to the app.
Match the pattern to its likely cause: downloads rising faster than first opens points to redownloads, attribution gaps or installs that never launch; first opens rising with flat first-task success points to eligibility or onboarding; early retention falling for new cohorts points to the first experience; stable new cohorts with fewer returning users points to established-user churn.
End with the narrowest supported finding: which population changed, at which measured step, over which complete window. If the data cannot locate the break, record a measurement question.